In a previous blog where I spoke on the necessity of an SOP for any athlete testing initiative, I touched on how the SOP likely helps limit measurement error, or noise in the data. While it can be reduced, measurement error will always be present when using any testing instrument. Therefore, it is important to account for this measurement error when examining athletes’ observed test scores. Due to this measurement error, there is an inherent uncertainty in the scores collected and analyzed. While measurement error is conceptually frustrating since it is the construct that is preventing us from identifying the true test score, it can also help us decide whether we confidently believe a physiological change has occurred.
I will not go fully into the equations or calculations needed to calculate estimates of measurement error, as I’m sure no one (except maybe Brennen) wants to get elbows deep in mathematics. For the example used in this blog, the standard error of measurement (SEM) statistic will be used to estimate measurement error for several metrics computed by the force plates used at HQ. Typically, a reliability study is conducted to obtain statistics for measurement error and reliability; however, often this is not feasible in an applied setting. Swinton et al. (2018) (2) provides a nice decision chart on how to obtain an estimate of measurement. In the case of our force plates, the SEM estimates I use come from a reliability study by Merrigan et al. (2021) (1). I felt comfortable using the study’s estimates because a) weightlifters were included in the sample and b) the study used the same force plates and protocol we use at HQ. It is very important to make sure the study sample and instrumentation are the same as your own testing situation if you are to use reliability estimates from another study. Nonetheless, this saved us a lot of time and headaches at HQ.
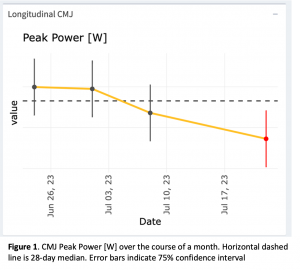
How to use an estimate such as SEM? Let’s take the SEM for countermovement jump (CMJ) Peak Power for instance. The SEM I use for Peak Power is 121 watts (W). Examining Figure 1., the red data point is 3345 W and the line running through the data point is a 75% confidence interval calculated using the SEM of 121 W. Essentially, the data point is our best estimate of Peak Power, however, if we repeated that day’s test an infinite number of times, we could expect the true Peak Power to be within the range of the line ~75% of the time. In this case, the range is 3206 – 3484 W.
The reason the data point is red is that the line range, or confidence interval, does not include the athlete’s average Peak Power (3531 W), which is indicated by the dashed horizontal. Therefore, we can be fairly confident the athlete’s Peak Power was below their average for that test session. Without the confidence intervals calculated using the measurement error, we may falsely conclude the athlete’s Peak Power was above or below their average. I would not confidently say any of the three black data points in Figure 1 are different from the athlete’s average Peak Power.
Uncertainty should also be considered when looking at change scores, such as the comparison from a test metric at Point A and Point B. Continuing with CMJ Peak Power as the metric being analyzed, we often want to compare two different time points to look for any physiological changes or compare how different parts of training may have affected the athlete’s physiology. For example, Figure 2 provides two examples of change scores for Peak Power.
Figure 2A displays an increase in Peak Power of 96 W. Without considering or visualizing any measurement error, we may heedlessly think, “Oh yeah! That’s a solid increase in Peak Power!”; however, measurement error must be included to give us a degree of uncertainty. Using the SEM of 121 W, we calculate a 75% confidence interval around the change score and find that a change of “0” (i.e., “no change”) is included in the confidence interval (-43 to 235 W change). If we repeated the two test points used to calculate the change score in Figure 2A a million times we would get some “no changes” or even some decreases in 75% of those repeats. This would not provide me with enough evidence to confidently tell Spencer, “Hey, your athlete’s Peak Power saw a worthwhile increase.” Conversely, Figure 2B displays a change score of 251 W with a 75% confidence interval of 112 to 390 W. The confidence interval being nowhere close to containing a change score of “0” would make me highly confident to tell Spencer, “Hey, your athlete’s Peak Power saw a worthwhile increase!”
This is just one example of how to propagate uncertainty in data points using measures of measurement error! There are many, many different error statistics, change scores, confidence intervals, and ways to interpret changes. Diving deeper into the statistics, however, is not the scope of this blog. If you are a coach looking to collect data on your athletes, I hope this makes it apparent the necessity of including measurement error to better understand the uncertainty and probability of data points and test scores. By neglecting the uncertainty in athlete testing, there is a greater risk of making false assumptions about changes in an athlete’s performance, subsequently making the data collected less insightful.
As always, if you have any questions about P&G sport science or applying the contents of this blog, please feel free to reach out!
Jake
- Merrigan, JJ, Stone, JD, Hornsby, WG, and Hagen, JA. Identifying Reliable and Relatable Force–Time Metrics in Athletes—Considerations for the Isometric Mid-Thigh Pull and Countermovement Jump. Sports 9: 4, 2021.
- Swinton, PA, Hemingway, BS, Saunders, B, Gualano, B, and Dolan, E. A statistical framework to interpret individual response to intervention: paving the way for personalized nutrition and exercise prescription. Front Nutr 5: 41, 2018.


